
Testing Purchasing Power Parity
Causes and Implications of Negative Externalities
October 25, 2022Strategies to Calculate National Income
October 25, 2022Testing Purchasing Power Parity
Within this paper a combination of univariate models (which assume the value of the exchange rate is based on its past values) and multivariate models (which will consider the trend in domestic and foreign prices) will be used to test the Purchasing Power Parity hypothesis. The data used will be the CPI for Japan and Sweden along with the exchange rate for the Japanese Yen and Swedish Krona. The paper will aim to find the best univariate and multivariate models and then compare their performance to the actual data.
For the univariate analysis the log of the exchange rate (et) and the respective growth rate (∆et) will be considered for the period of July 1997 – September 2013, the data for October 2013 – September 2014 will be emitted and used for testing the models.
1. Estimate appropriate ARMA models for the log of the nominal exchange e
And for the respective growth rate (∆e), carefully explaining how your models were selected.
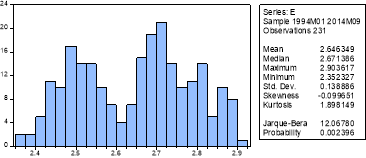

From initial inspection of the graph of et the data seems to follow a random walk but there is some evidence that it reverts to a fixed mean which could be an example of an AR(1) process with the coefficient close to 1. The histogram does not depict a normal distribution as there are a number of peaks, this is supported by the Jarque-Bera test and we can conclude we do not have a normal distribution as the P-value is insignificant at the 1% significance level and therefore we reject the null hypothesis of normally distributed errors.
